“Fraser Valley enjoys healthy market in February”
 The most recent news release by the Fraser Valley Real Estate Board states that the Fraser Valley housing market returned to more normal levels in February.
Sales and new listings are on-par with the 10-year average for the month of February.
Board President Gopal Sahota shares about the healthy state of the market:
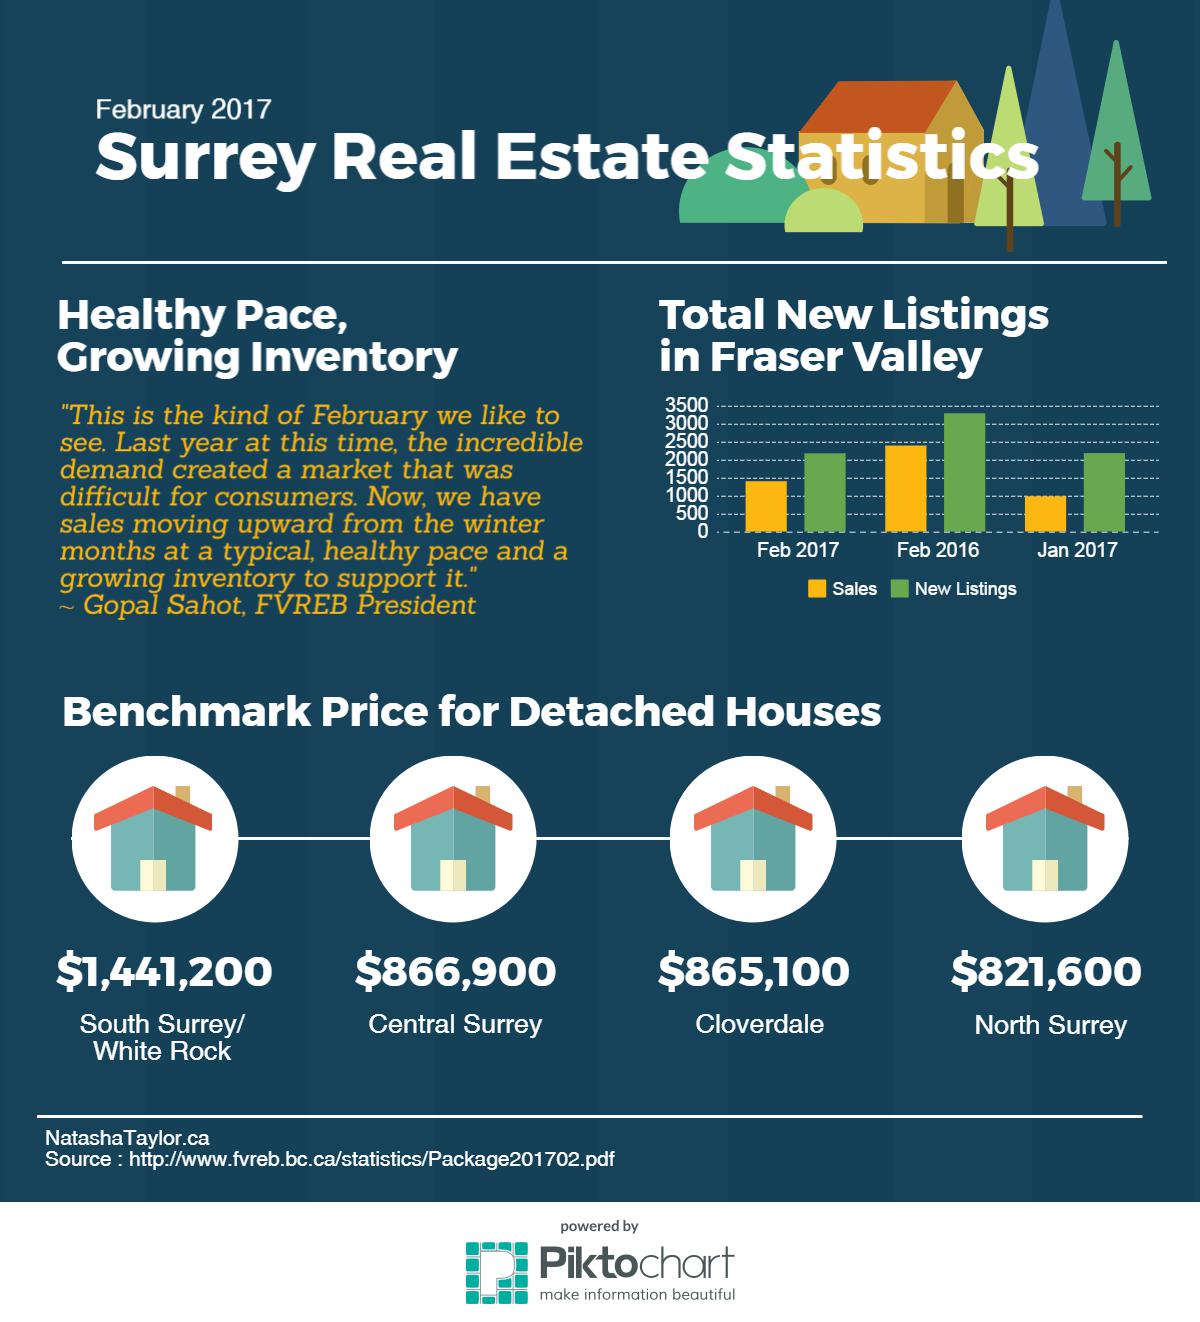
“This is the kind of February we like to see. Last year at this time, the incredible demand created a market that was difficult for consumers. Now, we have sales moving upward from the winter months at a typical, healthy pace and a growing inventory to support it.”
Furthermore, Sahota admits that housing prices are still heavily impacted by the activity and demand seen in 2016 despite the pace of the market returning to normal. He states that consumers may find this a challening environment to buy or sell, which is why he recommends talking to a REALTOR® to help guide you towards success.
As a Realtor specializing in White Rock and Surrey, I always like to see the tallied numbers for activity in the area. Here are Sales and Benchmark Prices for houses, townhouses, and condos throughout Surrey.
Surrey Houses (Detached)
Sales |
Feb 2017 |
Feb 2016 |
Jan 2017 |
| City of Surrey – Combined | 246 | 400 | 173 |
| White Rock/South Surrey | 73 | 223 | 44 |
| Surrey – Central | 95 | 253 | 72 |
| Surrey – Cloverdale | 44 | 88 | 23 |
| Surrey – North | 49 | 107 | 45 |
Benchmark Prices |
Feb 2017 |
Feb 2016 |
Jan 2017 |
| City of Surrey – Combined | $968,800 | $804,600 | $962,300 |
| White Rock/South Surrey | $1,441,200 | $1,163,900 | $1,422,700 |
| Surrey – Central | $866,900 | $712,300 | $862,000 |
| Surrey – Cloverdale | $865,100 | $733,600 | $863,200 |
| Surrey – North | $821,600 | $711,400 | $821,900 |
Surrey Townhouses
Sales |
Feb 2017 | Feb 2016 | Jan 2017 |
| City of Surrey – Combined | 227 | 250 | 126 |
| White Rock/South Surrey | 45 | 106 | 36 |
| Surrey – Central | 112 | 131 | 61 |
| Surrey – Cloverdale | 46 | 66 | 18 |
| Surrey – North | 26 | 36 | 12 |
Benchmark Prices |
Feb 2017 | Feb 2016 | Jan 2017 |
| City of Surrey – Combined | $449,700 | $357,900 | $445,800 |
| White Rock/South Surrey | $570,600 | $471,700 | $572,200 |
| Surrey – Central | $443,500 | $343,100 | $436,900 |
| Surrey – Cloverdale | $457,100 | $380,00 | $456,400 |
| Surrey – North | $355,500 | $267,400 | $348,300 |
Surrey Condos
Sales |
Feb 2017 | Feb 2016 | Jan 2017 |
| City of Surrey – Combined | 204 | 160 | 148 |
| White Rock/South Surrey | 73 | 112 | 56 |
| Surrey – Central | 26 | 38 | 20 |
| Surrey – Cloverdale | 29 | 30 | 21 |
| Surrey – North | 97 | 73 | 72 |
Benchmark Prices |
Feb 2017 |
Feb 2016 | Jan 2017 |
| City of Surrey – Combined | $267,000 | $220,400 | $261,900 |
| White Rock/South Surrey | $349,800 | $283,100 | $345,800 |
| Surrey – Central | $242,300 | $206,700 | $238,100 |
| Surrey – Cloverdale | $318,200 | $250,300 | $311,500 |
| Surrey – North | $244,800 | $204,700 | $239,900 |
Check out the full FVREB real estate package to see more real estate statistics for other areas such as North Delta, Langley, and Abbotsford.
For personalized advice on how these Surrey real estate statistics can affect your buying or selling a home in Surrey, BC please call Natasha Taylor of The Taylor Team at 1-778-319-4290 or fill out our contact form so we can be in touch with you.